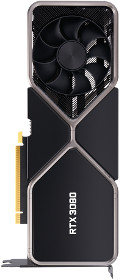
NVIDIA GeForce
RTX 3080
Ampere · 10 GB GDDR6X

NVIDIA GeForce VS NVIDIA GeForce GPU COMPARISON
Compare RightNow GPU Database specifications and median 3DMark Time Spy Graphics scores. The quick answer below is intentionally separated from game-specific FPS and live pricing.
Ampere · 10 GB GDDR6X
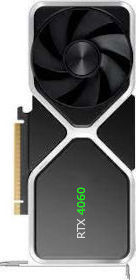
Ada Lovelace · 8 GB GDDR6
QUICK ANSWER
RTX 3080 has a median Graphics score of 17,664 versus 10,616 for RTX 4060, a lead of about 66% in this synthetic workload.
3DMARK TIME SPY
Median Graphics scores across submitted 3DMark Time Spy results; higher is better.
Time Spy is a synthetic DirectX 12 workload, not an FPS guarantee. Submitted results can include different board models, drivers, cooling, overclocks, and laptop power limits. Models are desktop GPUs unless explicitly labeled Laptop.
SPECIFICATIONS
Reference specifications from the RightNow GPU Database, whose upstream records come from TechPowerUp.
| Specification | RTX 3080 | RTX 4060 |
|---|---|---|
| Architecture | Ampere | Ada Lovelace |
| GPU codename | GA102 | AD107 |
| Foundry | Samsung | TSMC |
| Process size | 8 nm | 5 nm |
| Shader units | 8,704 | 3,072 |
| Base clock | 1,440 MHz | 1,830 MHz |
| Boost clock | 1,710 MHz | 2,460 MHz |
| Memory | 10 GB GDDR6X | 8 GB GDDR6 |
| Memory bus | 320-bit | 128-bit |
| Memory bandwidth | 760.3 GB/s | 272 GB/s |
| TMUs | 272 | 96 |
| ROPs | 96 | 48 |
| Tensor cores | 272 | 96 |
| Ray tracing cores | 68 | 24 |
| L2 cache | 5 MB | 24 MB |
| TDP | 320 W | 115 W |
| Recommended system power | 700 W | 300 W |
| PCI Express | PCIe 4.0 x16 | PCIe 4.0 x8 |
| Power connectors | 1x 12-pin | 1x 12-pin |
| Display outputs | 1x HDMI 2.1, 3x DisplayPort 1.4a | 1x HDMI 2.1, 3x DisplayPort 1.4a |
| DirectX | 12.2 | 12.2 |
| Vulkan | 1.4 | 1.4 |
| OpenGL | 4.6 | 4.6 |
| FP32 performance | 29.77 TFLOPS | 15.11 TFLOPS |
RTX 3080: RightNow GPU Database · upstream record · retrieved Aug 20, 2026
RTX 4060: RightNow GPU Database · upstream record · retrieved Aug 20, 2026
HOW TO CHOOSE
A useful choice depends on performance, memory, power, price, and the games or workloads you actually use.
RTX 3080 has a median Graphics score of 17,664 versus 10,616 for RTX 4060, a lead of about 66% in this synthetic workload. Treat a result within roughly three percent as effectively close in this synthetic workload.
RTX 3080 lists 10 GB GDDR6X and 320 W graphics power; RTX 4060 lists 8 GB GDDR6 and 115 W. Board-partner models can use different coolers, limits, and connectors.
This comparison does not invent FPS or value claims. Check independent testing for your games and resolution, then compare the current prices of the exact cards available to you.